Edit chart
Loading graph
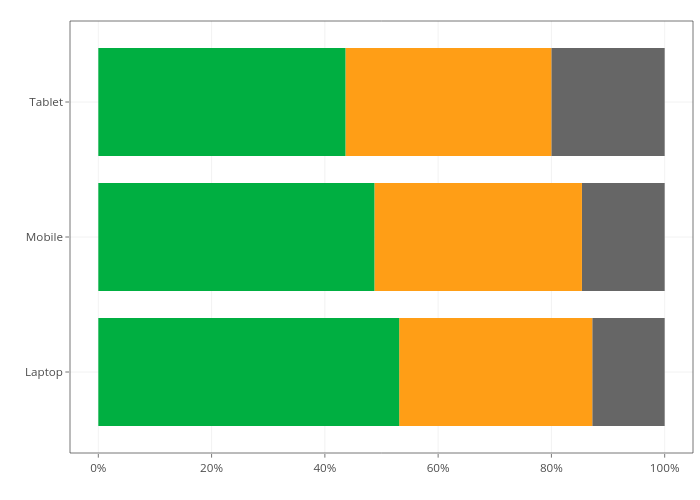
Oliverly's interactive graph and data of "(End of life,1), (Repairable,1), (Fixed,1)" is a , showing (End of life,1), (Repairable,1), (Fixed,1). The x-axis shows values from -0.05 to 1.05. The y-axis shows values from 0.4 to 3.6.